
What?
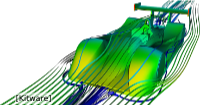
Scientific Visualization is a field of Computer Science that studies the process of generating intelligible and interactive graphical representations of scientific data-sets, either obtained from numerical simulations (computational fluid dynamics, mechanical design, cosmology, chemistry, etc.) or acquisition (medicine, seismology, etc.).As such, visualization is an essential component of the modern scientific methodology pipeline, which plays a key role in research and development activities through:
· The visual exploration of scientific data for hypothesis formulation, model verification or intuition validation;
· The geometrical analysis and interpretation of numerical results;
· The communication of scientific results through graphical and interactive material.
Scientific Visualization covers several topics of computer science, including for example:
· 3D Rendering,
· User interactions,
· And most importantly geometrical and topological analysis of discrete scientific data.
Who?
This class targets students (Master level) following computer science tracks, covering topics such as:· Scientific Engineering,
· Modeling and Simulation,
· Applied Mathematics,
· Computer Graphics or
· Multimedia Engineering.
The instructors for this class are:
· Julien Tierny, CNRS, Head instructor;
· Tobias Isenberg, INRIA;
· Charles Gueunet, LIP6 - Kitware.
What for?
The content of this class is useful for any student targeting research and development activities (either in the academy or the industry) in physical sciences, numerical simulation, scientific engineering or software engineering.It provides knowledge that is complementary to numerical simulation classes, as visualization is an essential component of the simulation pipeline.
It is also a "must-select" for students targeting jobs in 3D modeling, simulation, analysis and rendering software industry.
Detailed syllabus
The class is composed of 6 lectures (1h30 each), covering the following topics:
|
Introduction to scientific visualization
Instructor: Julien Tierny. This lecture presents a general introduction to scientific visualization, its purpose, its motivations and its scope. Exercise package. |
|
|
Domain representations
Instructor: Julien Tierny. This lecture presents the formalisms, data-structures and algorithms for the representation and manipulation of numerical domains and shapes: · Euclidean sub-spaces: 1D, 2D, 3D and nD regular grids; · Non-euclidean spaces: 1D, 2D, 3D and nD piecewise-linear manifolds (triangulations). Exercise package. |
|
|
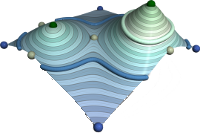
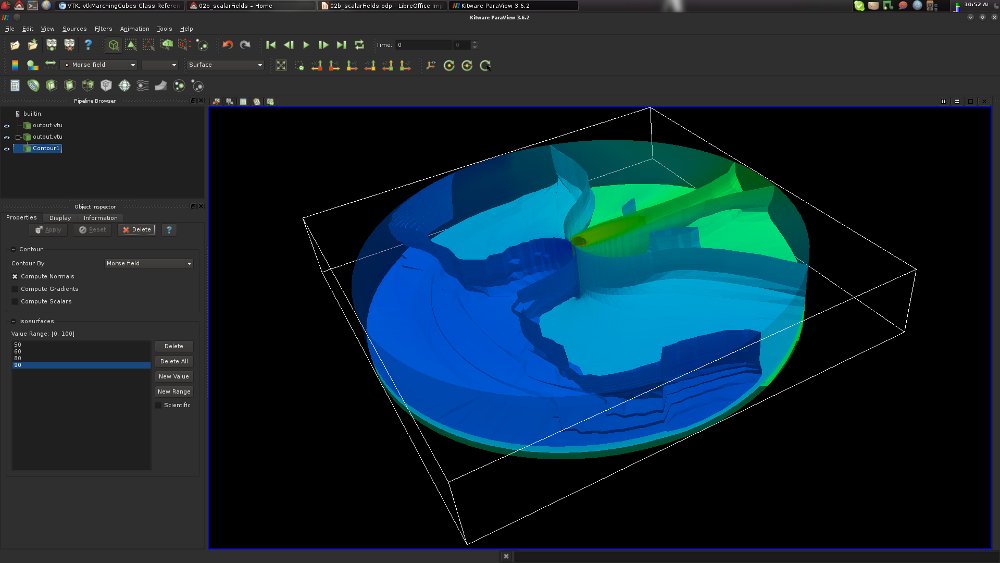
Scalar field visualization
Instructor: Julien Tierny. This lecture presents the fundamental techniques for the graphical representation of scalar fields (usually found in all types of numerical simulations): · Color maps and volume rendering; · Level-set extraction; · Accelerating structures; · Scalar field topology and simplification; Exercise package. |
|
|
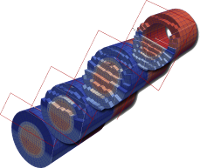
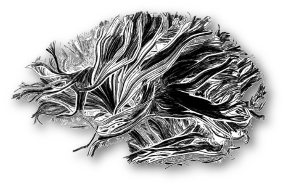
Vector field visualization
Instructor: Julien Tierny. This lecture presents the fundamental techniques for the graphical representation of vector fields (usually found in computational fluid dynamics): · Integral line and integral surface computation; · Integral line convolution; · Derived scalar fields; · Vector field topology; Exercise package. |
|
|
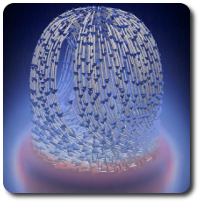
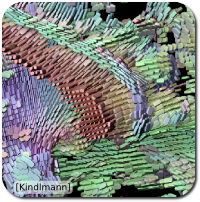
Tensor field visualization
Instructor: Julien Tierny. This lecture presents the fundamental techniques for the graphical representation of tensor fields (usually found in mechanical design, meshing, diffusion simulations, etc.): · Glyph generation and packing; · Derived scalar and vector fields; · Hyper integral lines; · Hyper integral line convolution; · Tensor field topology; Exercise package. |
|
|
Illustrative visualization
Instructor: Tobias Isenberg. This lecture presents an introduction to illustrative visualization for scientific data. |
|
Instructor: Charles Gueunet.
|
|
These sessions will re-visit from a practical perspective the topics covered during the lectures, including:
· Introduction to Paraview and review of the conversion of numerical data-sets to Paraview and VTK formats;
· Isosurface extraction in scalar fields;
· Integral line computation;
· Glyphs representation and packing.
Personal work
The grading of this class is based on three evaluations:· A written exam (last session of the class, 33% of the global grade);
· A scientific seminar where each student presents a recent scientific paper on visualization for 15 minutes (last session of the class, 33% of the global grade);
· Programming exercises (33% of the global grade);
Last year's average global grade for the class was: 14.07/20.
Programming exercises
Each programming exercise will be graded. At the beginning of each exercise session, students are expected to return their complete implementation of the previous exercise session.Last year's exercise average grade was: 13.66/20.
Seminar
· At the beginning of the class, a list of recent scientific papers on visualization is presented to the students. Each student must select one paper to present.· A written abstract of the paper (up to 2 pages) must be sent to the instructors a week prior to the actual seminar. This abstract accounts for 25% of the seminar grade.
· During the last session of the class, each student presents his/her paper, explaining what the contributions of the paper are, what its strengths and weaknesses are and why he/she personally chose to present this paper.
· Each presentation is followed by a 5 minutes QA session.
Last year's seminar average grade was: 14.15/20.
>>> Seminar webpage.
Exam
A 20-minute written exam will be given at the beginning of the last session of the class (multiple choice test).Last year's exam (pdf).
Last year's exam average grade was: 14.38/20.
References
· Paraview· The Visualization Tool Kit
· The Visualization Tool Kit Textbook
Internships, Ph.D. Thesis, permanent positions in visualization
Each year, several research internships on visualization topics (topology analysis, rendering, data-exploration) are proposed (either in academic or industrial environments). These internships can usually be followed by a Ph.D. thesis. Please contact the instructors for more information.2018-2019
Open research engineer position 1 at Cintoo (Nice, France)Open research engineer position 2 at Cintoo (Nice, France)
Open research engineer position on topological data analysis and visualization at Sorbonne
Open Master Internship 1 on topological data analysis and visualization at Sorbonne (with Ph.D. continuation)
Open Master Internship 2 on topological data analysis and visualization at Sorbonne (with Ph.D. continuation)
Open Master Internship 3 on topological data analysis and visualization at Sorbonne (with Ph.D. continuation)
Open Master Internship 4 on topological data analysis and visualization at Sorbonne (with Ph.D. continuation)
Open Master2 Internship on topological data analysis and visualization of 3D scientific data at Total (Pau, France)
Open Master2 Internship 1 on topological data analysis at BMW (Munchen, Germany)
Open Master2 Internship 2 on topological data analysis at BMW (Munchen, Germany)
Open Master2 Internship 3 on topological data analysis at BMW (Munchen, Germany)
Open Master2 Internship 4 on topological data analysis at BMW (Munchen, Germany)
Open Master2 Internship 5 on topological data analysis at BMW (Munchen, Germany)
Open Master2 Internship on topological data analysis and visualization of 3D scientific data at CEA (Le Barp, France)
One permanent engineer position in 3D data analysis and visualization at Total! (Saclay, France)
2017-2018
Open Master Internship 1 (at UPMC)Open Master Internship 2 (at UPMC)
Open Master Internship 3 (at UPMC)
Open Master Internship 4 (at UPMC)
Open Master Internship 5 (at UPMC)
Open Master Internship 6 (at UPMC)
Open Master Internship 7 (at INRIA, Aviz team)
Open Master Internship 8 (at ISCD)
Open Master Internship 9 (at ISCD)
Open Ph.D. position in New Orleans (at Tulane University)
Five permanent software engineer positions in 3D data analysis and visualization and HPC at Kitware! (Lyon, France)
One permanent software engineer position in 3D data analysis and visualization at CEA! (Bordeaux, France)
One permanent software engineer position in 3D modeling and mesh generation at Coventor (Paris, France)
Updated on February 26, 2019.